I’ve gone from recording lots of information about my riding to recording zero and back again. There’s something about seeing the miles I ride that makes me feel good.
While some may think of bicycling in terms of miles ridden (or, in the case of my race-training husband, average, peak, and current power measured in wattage), lots of numbers come into play on any ride. Just for fun I’m sharing some of those that occurred to me on a recent morning bike ride to work.
804: Calories burned during the ride, according to my heart rate monitor.
173: Maximum heart rate during the ride, courtesy of a very steep, short climb near the beginning of my ride that feels much steeper because I’ve already been climbing for a half-mile before I make a sharp right and face the real steepness. I’m not warmed up yet and it feels much harder than it would later in the ride.
***: Number of pounds I put on the bike personally (ahem) before loading my pannier, a number I believe will decrease if I increase the number of days per week I ride to work–as long as I don’t offset calories burned with pastries.
120: How many numbered streets lie between my home address and my work address. But this is Seattle, so don’t imagine this as a straight line from 120th counting down to First.
66: Number of minutes total commute time (made somewhat longer by my choice of route on this particular day–I mix it up).
55: Actual number of minutes pedaling, which my cyclometer tells me.
38: The temperature when I left the house.
26.8: Maximum miles per hour attained–definitely on a downhill.
24: Number of gears I have with my triple ring to help me tackle the uphills and enjoy the downhills.
16: Ounces of water consumed along the way, made much more interesting by a Nuun electrolyte tablet (cherry limeade–it’s caffeinated!).
15: Number of cars I passed at stoplights because I had a bike lane and they were stuck in traffic behind other cars stuck in traffic behind other cars stuck in traffic behind…. You take my point. Even when a bunch of bikes end up at a light “stuck in traffic” we can fit 3-5 bikes in the length of one vehicle; more of us can get through any given light if we have a bike lane.
11.2: Average miles per hour. I might feel slow if I didn’t know how many hill climbs are included in this.
10.38: Number of miles ridden. My ride ranges from something around this to 14+ miles, depending on whether I make use of the Burke-Gilman Trail (flatter but winding and thus longer).
10: Number of minutes I think my climb on Roosevelt Way from Northgate Way to 93rd will take when I’m at the bottom looking up.
5: Actual number of minutes the climb on Roosevelt takes, proving Einstein’s Theory of Relativity. (It’s all about the observer.)
5: Estimated number of minutes lost thrashing about to pick my way through the ongoing construction from Eastlake on Mercer, which I could have avoided if I’d taken another route.
5: Number of traffic lights I had to stop at this particular morning.
4.6: Miles per hour on that first steep, short climb that makes my heart pound. At least I’m not so slow that I actually fall over.
4: The maximum percentage grade on any portion of my route, according to MapMyRide. But–but–it feels steeper! And here’s the weird part–the 4% grade is near the end of my Roosevelt Way climb, not that first climb that looks/feels steeper. That one is only 3%. Shows what a difference being warmed up makes to perceived effort.
3: Number of people driving cars who politely and safely waited for me to get past them in the bike lane before they turned right. Thank you!
3: The number of coffee shops with baked goods or gelato within a half-block of our office, making this whole calories burned vs. goodies consumed equation come out upside down some days.
1.75: The number of miles I’ve ridden when I start my second climb that feels like work, the 5-minutes-that-look-like-10 in the bike lane on Roosevelt.
1: Number of people driving cars who turned right in front of me across the bike lane on Roosevelt at 72nd with apparently no knowledge that she had just come so close I could have rapped on her rear quarter panel if I did that sort of thing. I was tempted. And if I’d thought quickly enough I’d list one more number in this post–the license plate number.
1: Number of people on bikes I talked with about what a beautiful day it was for a ride while we waited together at a stoplight. The number of people I talk with on any given commute is usually 1 or more. I’m chatty.
.9: The number of miles I’ve ridden when I finish the first short, steep climb. This climb also measures strength gain for me; when I started riding from our current neighborhood I had to push my bike part of the way up this and now I ride it.
.9: In an odd coincidence, the length of my second climb on Roosevelt Way from Northgate to 93rd.
0: The number of stoplights I wait at because I’m on a bike. (Trick statistic–“because I’m on a bike” doesn’t have anything to do with it. Drivers wait at the same lights.)
0: Number of people on bikes who passed me. This does not represent a typical day. Normally I would have been passed by more people but for some reason I encountered fewer riders than usual. I’m often waiting with 6-8 others in the bike lane when we stop at the light at Roosevelt and NE Campus Parkway.
0: Number of people I passed because I rode faster. This also doesn’t represent a typical day; I generally pass someone on Roosevelt somewhere along the way, or on Eastlake. Not that it’s a race or anything.
0: Amount I paid for gas, parking, or tolls. Note that zero is not the amount I pay for the streets on which I ride. Sales tax, property tax, and federal income tax, all of which I pay, subsidize over 50% of the cost of Washington’s streets and roads. That is, activities unrelated to driving subsidize the roads–a subject for another day’s post.
Unmeasurable and priceless: The joy, tech-free thinking time, feelings of strength and freedom, money saved, spirit of local adventure, and improved health* I get every time I ride.
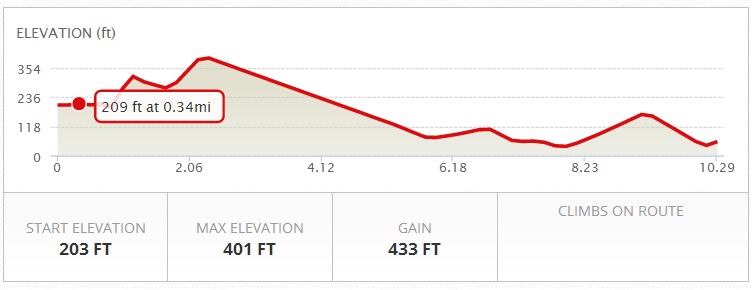
Elevation profile for my commute to work. It’s not the Cascade mountain range by any stretch of the imagination and the more I do it the easier it gets. But I feel it.
*Research demonstrates many measurements of how much I reduce my risk of breast cancer, heart disease, obesity, diabetes, premature death, and other things by bicycling regularly, but I’m thinking more of my subjective and qualitative feelings of health and strength.
Your Turn:
- Do you track data about your riding? Why or why not?
- What numbers or data types matter to you?


4 Comments
Top cities with people who bike to work:
http://www.towncharts.com/Top-500-Cities-in-the-US-for-People-Who-Bike.html
I rode with my husband the other day and his GPS gave me better information on what a 3% grade looks like compared to a 9% or more. Those hills on my commute ARE steeper than MapMyRide indicates!
http://wabikes.org/2014/04/27/30-days-biking-day-27-jerseys/
Thanks, @ebgwa! I always chat with other bike folk at stoplights so if we cross paths that’s a for-sure.
I loved your post Barb, way to go. I hope we pass each other or come to a stop together, I’ll be sure to chat at ya 🙂
One Trackback
[…] By the Numbers: A Morning Bike Commute (2014) […]